The Deficit Is Not a Partisan Talking Point. It Is a Warning.

Julie’s Journal
Hello, friend—this newsletter involves some heavy lifting - we can do it, right?
Preview text: From Obama through Trump, the numbers reveal a problem much larger than one president—or one political party.
The central finding is that the deficit fell from 9.8% of GDP in FY2009 to 3.1% in FY2016, began rising again before COVID, surged during the pandemic, and remained near 6% of GDP afterward. CBO currently projects 5.8% in 2026, 5.7% in 2027, 5.6% in 2028, and an adjusted 6.0% in 2029.
Hello, friend—this newsletter involves some heavy lifting - we can do it, right?
We hear the word deficit so often that it can begin to sound like background noise: a very large number, followed by finger-pointing, followed by everyone returning to their preferred version of the story.
But the federal deficit is not an abstraction. It is the annual gap between what the government spends and what it collects. When that gap persists, it adds to the national debt—and the interest on that debt begins consuming money that could otherwise support defense, infrastructure, health care, education, disaster response, or tax relief.
The fairest way to compare deficits across time is not simply by dollars. The economy grows, prices rise, and a trillion dollars today is not the same as a trillion dollars fifteen years ago. Economists therefore often compare the deficit with gross domestic product, or GDP—the total size of the economy.
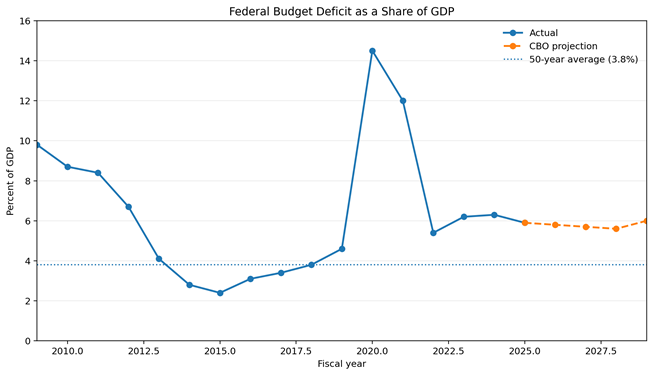
Figure 1. Actual deficits through FY2025; CBO baseline projections for FY2026–FY2029. Deficits are displayed as positive magnitudes.
What happened under Obama?
President Obama entered office during the worst economic collapse since the Great Depression. In fiscal year 2009, the deficit reached 9.8 percent of GDP. That figure reflected the recession, emergency financial stabilization, automatic increases in safety-net spending, and policies enacted across the transition from George W. Bush to Obama.
As the economy recovered, the deficit fell sharply: 8.7 percent in 2010, 6.7 percent in 2012, 4.1 percent in 2013, and 2.4 percent in 2015. It rose again to 3.1 percent in 2016, Obama’s final full fiscal year.
That decline was real and significant. It was also helped by an expanding economy, the winding down of emergency recession spending, tax changes, and spending restraints. Presidents influence deficits, but they do not control them alone; Congress, economic conditions, interest rates, and inherited laws all matter.
What happened during Trump’s first term?
The deficit began rising before the pandemic—from 3.4 percent of GDP in 2017 to 3.8 percent in 2018 and 4.6 percent in 2019. This matters because the economy was relatively strong and unemployment was low. Historically, those are the years when governments have had the best opportunity to narrow the gap.
Then came COVID-19. Emergency relief, business support, direct payments, reduced tax collections, and the economic shutdown drove the fiscal-year 2020 deficit to 14.5 percent of GDP. That was an extraordinary crisis-year number, not a normal measure of the administration’s ongoing fiscal policy.
What happened under Biden?
The pandemic-era deficit remained enormous in fiscal year 2021 at 12.0 percent of GDP, then fell to 5.4 percent in 2022 as emergency programs expired and the economy normalized.
But the deficit did not return to the pre-pandemic range. It rose to 6.2 percent in 2023 and 6.3 percent in 2024. Fiscal year 2025 ended at roughly 5.9 percent of GDP. Here again, attribution is messy: fiscal years cross presidential terms, Congress writes spending and tax laws, and interest costs reflect borrowing accumulated over many years.
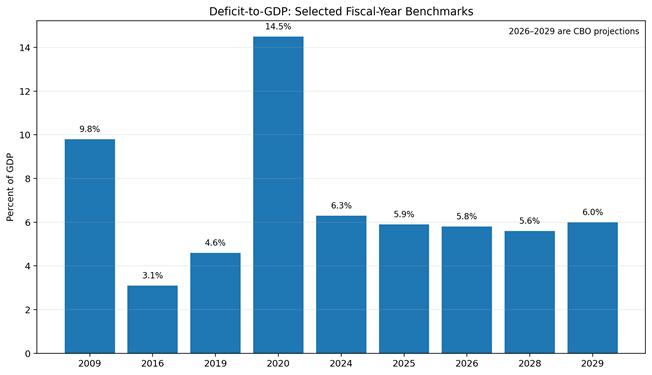
Figure 2. Selected benchmarks help separate ordinary fiscal years from the Great Recession and COVID-19 emergency spikes.
Where are we now—and where are we headed?
The Congressional Budget Office projects a fiscal-year 2026 deficit of about $1.9 trillion, equal to 5.8 percent of GDP. That is almost unchanged from 2025 and far above the 3.8 percent average of the past fifty years.
For the years closest to the end of President Trump’s current term, CBO projects the deficit at 5.7 percent of GDP in 2027 and 5.6 percent in 2028, after adjusting for quirks in the timing of federal payments. For fiscal year 2029—which begins in October 2028 and extends well beyond the January 2029 presidential transition—the adjusted deficit rises to 6.0 percent of GDP.
That timing distinction matters. A president’s term does not line up neatly with the federal fiscal year. The cleanest end-of-term comparison is therefore FY2028, while FY2029 is better understood as the first budget year carrying forward many policies already in law.
CBO’s baseline is not a prediction carved in stone. It assumes current laws generally remain in place. Recessions, wars, new legislation, court decisions, tariffs, immigration policy, and interest rates could all move the numbers substantially.
Steve Rattner’s warning about optimistic growth
Economist and investor Steve Rattner has repeatedly used charts to challenge rosy fiscal claims. In discussing the Trump administration’s 2027 budget, he pointed to a central disagreement: the administration assumed real economic growth of roughly 3.1 percent in 2026 and the following two years, while other forecasters were closer to 2 percent.
That difference is not academic. Faster growth increases tax revenue and makes debt and deficits look smaller relative to GDP. When a budget depends on unusually optimistic growth, the promised deficit improvement can disappear if the economy performs more normally.
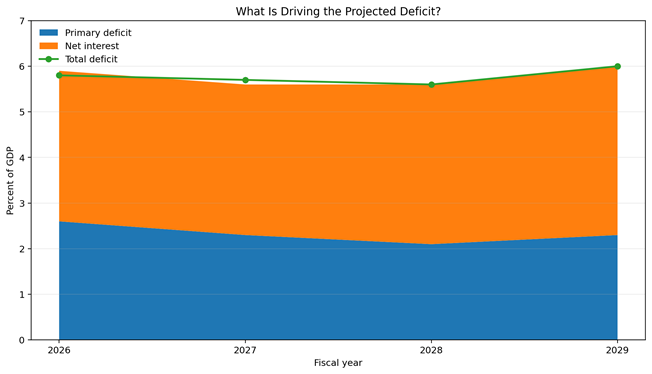
Figure 3. CBO projects that interest costs will consume a growing share of the deficit even as the primary deficit remains large.
The part politicians prefer not to say aloud
This is not a story in which one party behaved responsibly and the other did not.
Republicans have supported large tax reductions without matching spending cuts. Democrats have defended or expanded major programs without consistently identifying enough revenue to pay for them. Both parties approved emergency spending during genuine crises. Both have also discovered that voters like benefits and tax cuts far more than they like the sacrifices required to balance a budget.
The deeper problem is structural. Social Security and Medicare costs are rising as the population ages. Health-care costs remain high. Interest payments are climbing. Revenue is not keeping pace with total commitments. And we are running deficits near 6 percent of GDP during a period when unemployment is projected to remain below 5 percent.
CBO notes that when unemployment was below 5 percent in earlier decades, total deficits averaged only 2.6 percent of GDP. Today’s projected deficits are more than twice that level.
So what should we ask of our leaders?
Not another slogan. Not another promise that tax cuts will entirely pay for themselves. Not another claim that eliminating waste, fraud, or foreign aid will solve a problem measured in trillions.
We should ask for arithmetic.
Which taxes would change? Which programs would change? Who would pay more? Who would receive less? How would the plan protect people who genuinely depend on Social Security, Medicare, Medicaid, veterans’ benefits, and other essential programs? And what happens if the promised economic growth does not arrive?
A serious country can choose its priorities. But it cannot indefinitely pretend that every priority is free.
The deficit is not simply a number on a government spreadsheet. It is evidence that we have promised ourselves more than we are currently willing to pay for—and sent the bill forward.
That is not a Democratic problem or a Republican problem.
It is ours.
Until next time,
Julie Bolejack, MBA
The Mindful Activist
Please share to avoid the overlords and algorithms: julies-journal.ghost.io
Notes and Data Cautions
· All figures are federal fiscal-year figures. The federal fiscal year runs from October 1 through September 30 and does not align perfectly with presidential terms.
· Deficit percentages are shown as positive magnitudes in the charts for easier reading. Official budget tables often display deficits as negative numbers.
· FY2009 and FY2021 straddle presidential transitions and should not be attributed entirely to one president.
· FY2028 is the last full fiscal year ending before the conclusion of President Trump’s current term. FY2029 begins in October 2028 but continues through September 2029.
· The CBO projection series in the charts is adjusted to remove artificial shifts caused when scheduled federal payments move between fiscal years.
Sources
· Congressional Budget Office, The Budget and Economic Outlook: 2026 to 2036, February 11, 2026.
· Office of Management and Budget, Historical Table 1.2: Summary of Receipts, Outlays, and Surpluses or Deficits as Percentages of GDP, 1930–2025.
· Federal Reserve Bank of St. Louis FRED, Federal Surplus or Deficit as Percent of GDP.
· Steve Rattner, “Trump’s Budget Puts Defense First—and the American People Last,” April 2026.
· Committee for a Responsible Federal Budget, analyses of the February 2026 CBO baseline and administration growth assumptions.
My take: neither party gets to claim innocence, emergency years should not be treated as ordinary years, and leaders should be required to show the arithmetic behind their promises.


